I have a weakness for the reports nobody wants to touch — the one that eats a week of every month, that everyone works around instead of fixing, because fixing it is never this month's problem. I can't leave them alone. This is the story of one of them.
It belonged to an online-sales division I was working with: the monthly performance scorecard.
The ritual
Ten exports came out of the CRM every month, one per report, and not one of them shared a key with the others. So every month, someone sat down and rebuilt the whole picture by hand — filtering each file to the region, cleaning it by its own particular rules, rolling it up division by division and person by person, until it became one scorecard an executive could use to actually coach a team.
It worked. It also quietly cost the first week of every month, and it got heavier each time — more months to compare, more people to track, more places for a number to drift. And since it was rebuilt from scratch every time, it was only ever as consistent as whoever happened to build it that month.
That last part is what I couldn't get past. It wasn't the tedium. It was that a real decision — about real people's performance, the kind that changes how someone gets coached — was resting on a spreadsheet stitched together from nothing, thirty days at a time.
I didn't want to make it faster. I wanted to make it stop.
There's an easy version of this job: make the manual process a little quicker. A cleaner template, a few macros, done. I've watched a lot of “sales ops” end right there — and it's still a spreadsheet, still one bad copy-paste from being wrong, still somebody's week.
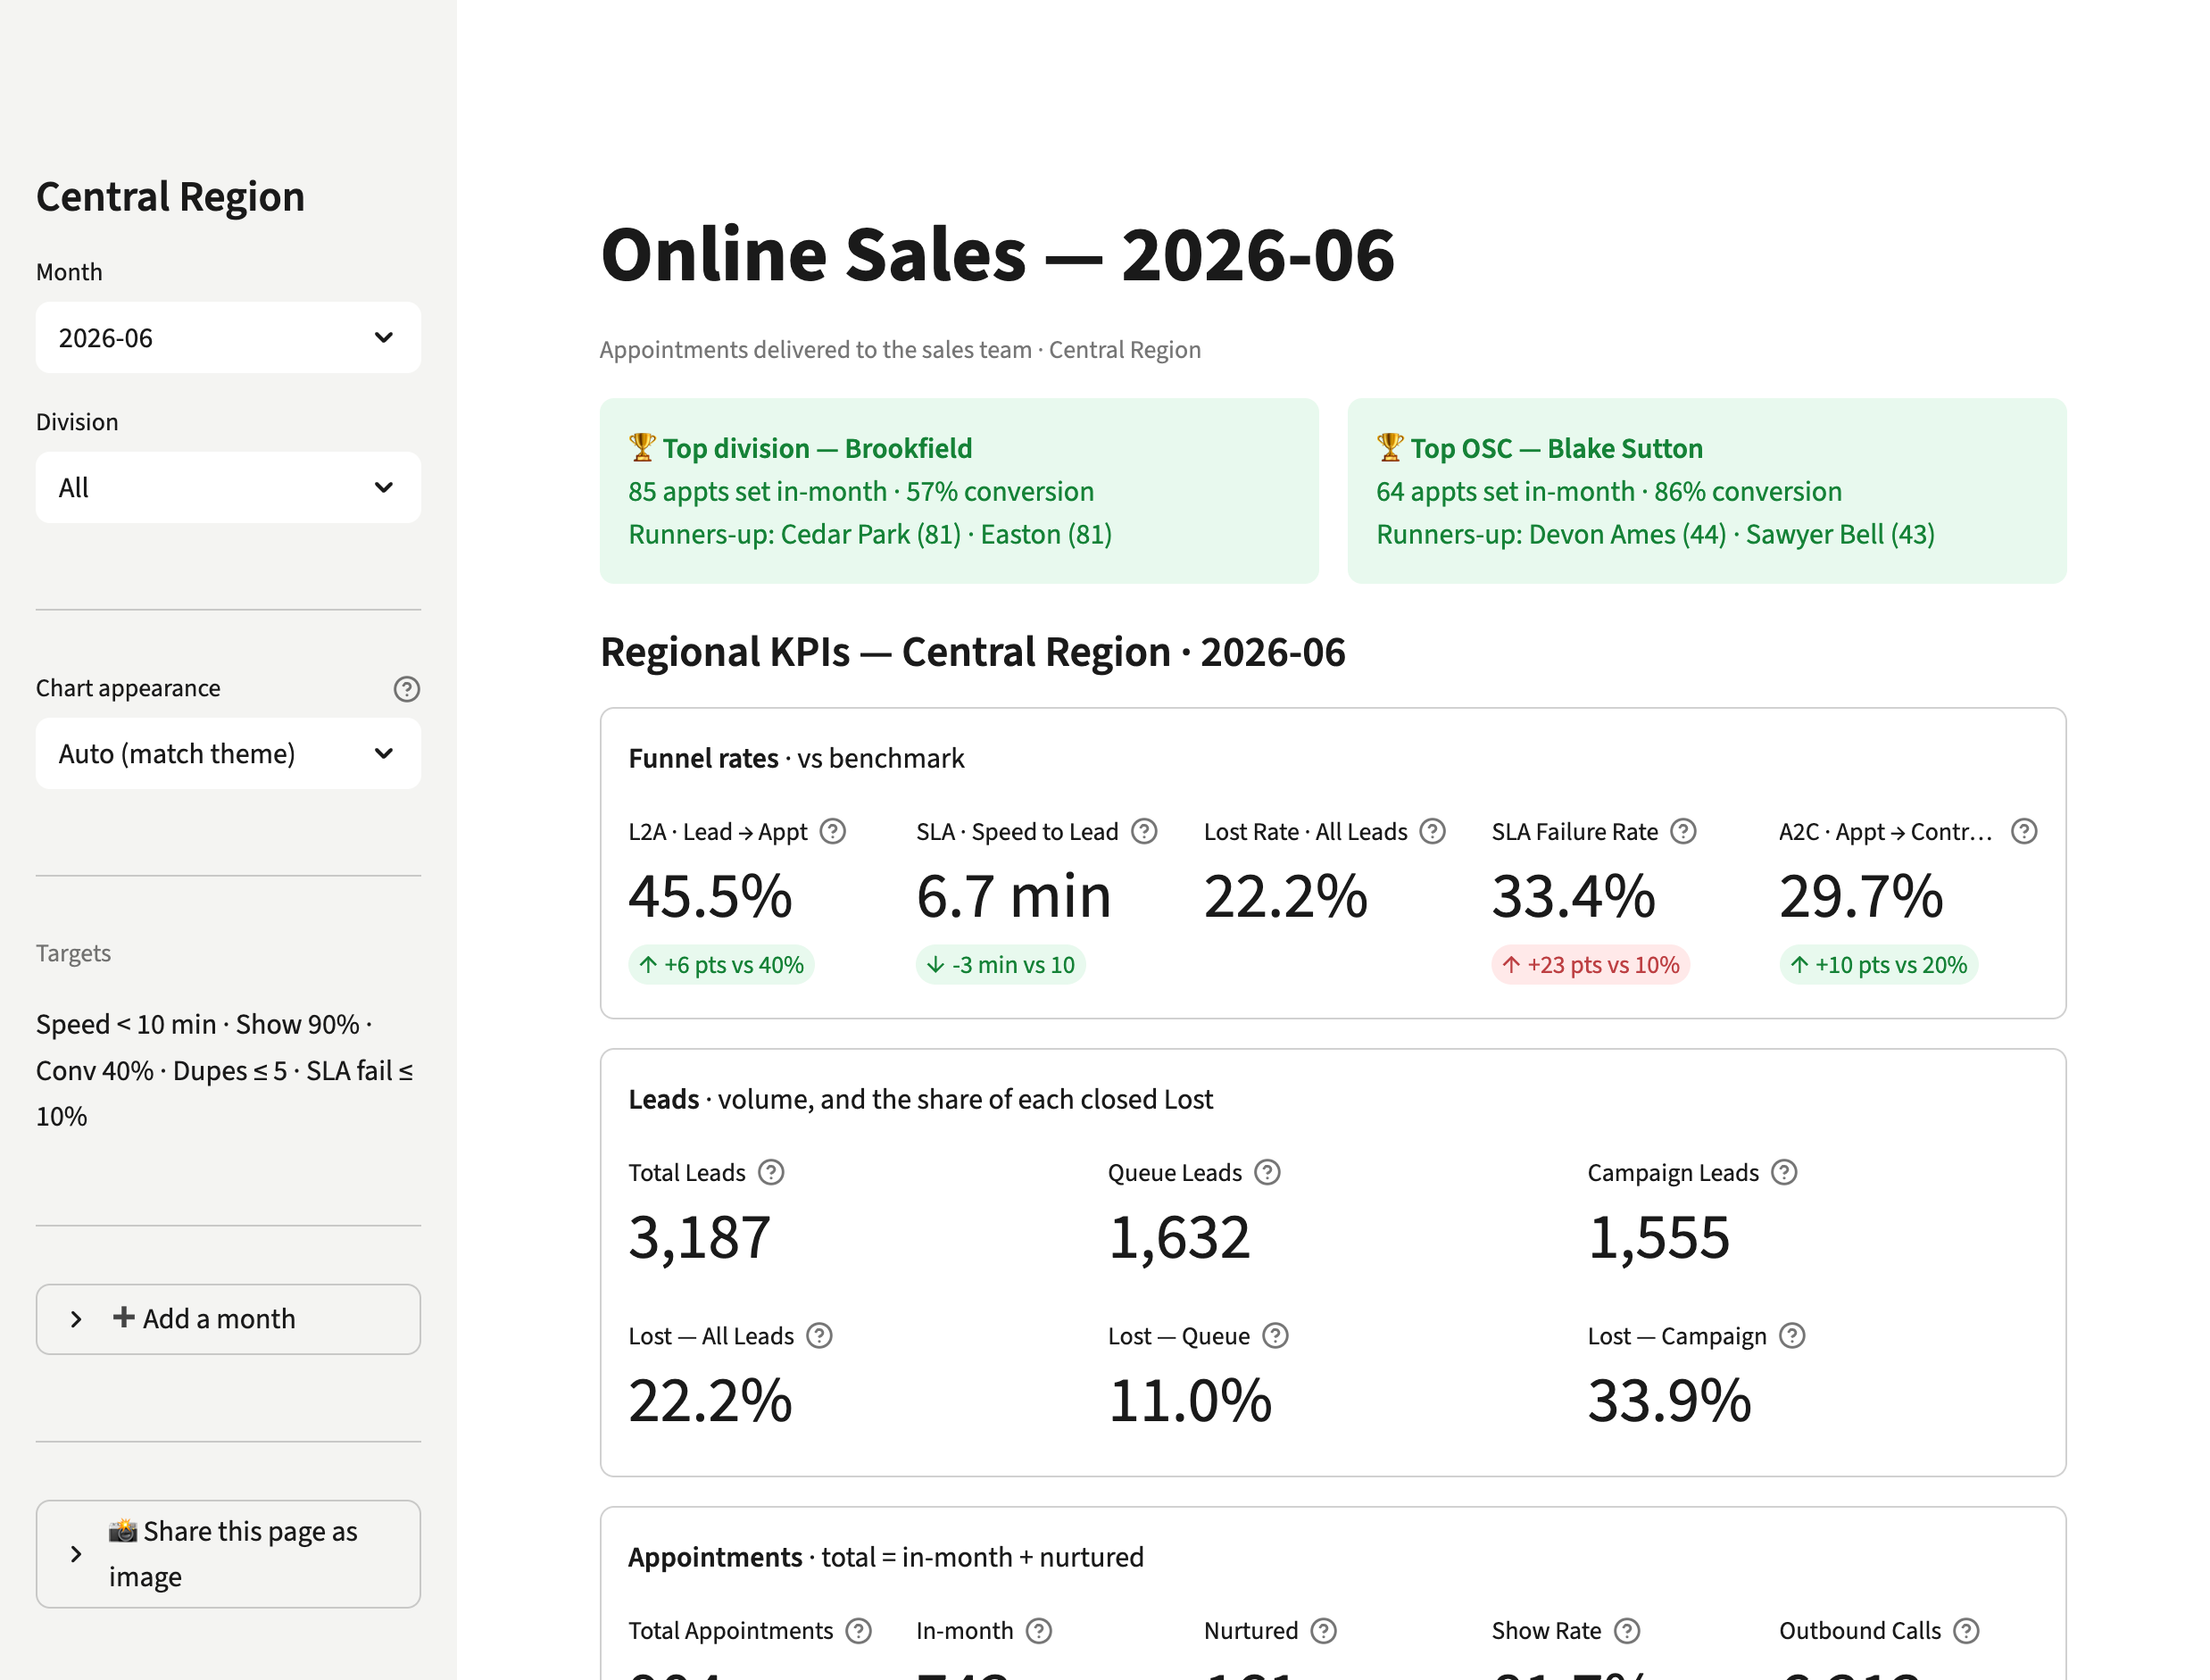
So I built the actual thing. You drop the ten exports in. It cleans each one by its rules, rolls everything up, and rebuilds the entire scorecard — the leaderboards, the driver correlations, the flags for who's slipping and who's clearing benchmark. The second a comparison month exists, the month-over-month, quarter, and year views show up on their own, pooled from the raw counts instead of averaged, so the trend is real and not a smear.